Layer 4 — Applied Intelligence

Respeck Activity Recognition

Wearable accelerometer pipeline for activity classification and long-term behavioural analysis. Feature engineering, two-stage hierarchical classifier, and CNN inference on Respeck chest sensor data at 12 Hz.

Machine Learning Wearable / Clinical Signal Processing
12 HzSensor Sample Rate
50 samplesWindow Size (4.17 s)
12+ classesFine Activity Labels
2-StageHierarchical Classifier
RF · XGB · SVMModels Compared

Overview

The Respeck is a small chest-worn sensor patch containing a 3-axis MEMS accelerometer sampling at 12 Hz, originally designed for clinical respiratory monitoring. Its 12 Hz rate gives a Nyquist limit of 6 Hz — more than sufficient for human locomotion: walking step frequency peaks at 1.5–2.5 Hz, running at 2.5–4.0 Hz. This project uses the Respeck accelerometer signal for physical activity recognition and long-term behavioural analysis.

The work has two complementary parts. The first is a clean inference pipeline that applies a pre-trained CNN model to long multi-hour recordings, chunking them into 50-sample windows (4.17 s), classifying each window, and producing hourly and daily activity summaries. The second is a deeper classifier study — a comprehensive comparison of single-stage and two-stage hierarchical classifiers using handcrafted time- and frequency-domain features — exploring how well different model families can separate a larger set of fine-grained activity classes including several lying postures, shuffling, sitting/standing transitions, and stair variants.

Raw Signal Characteristics

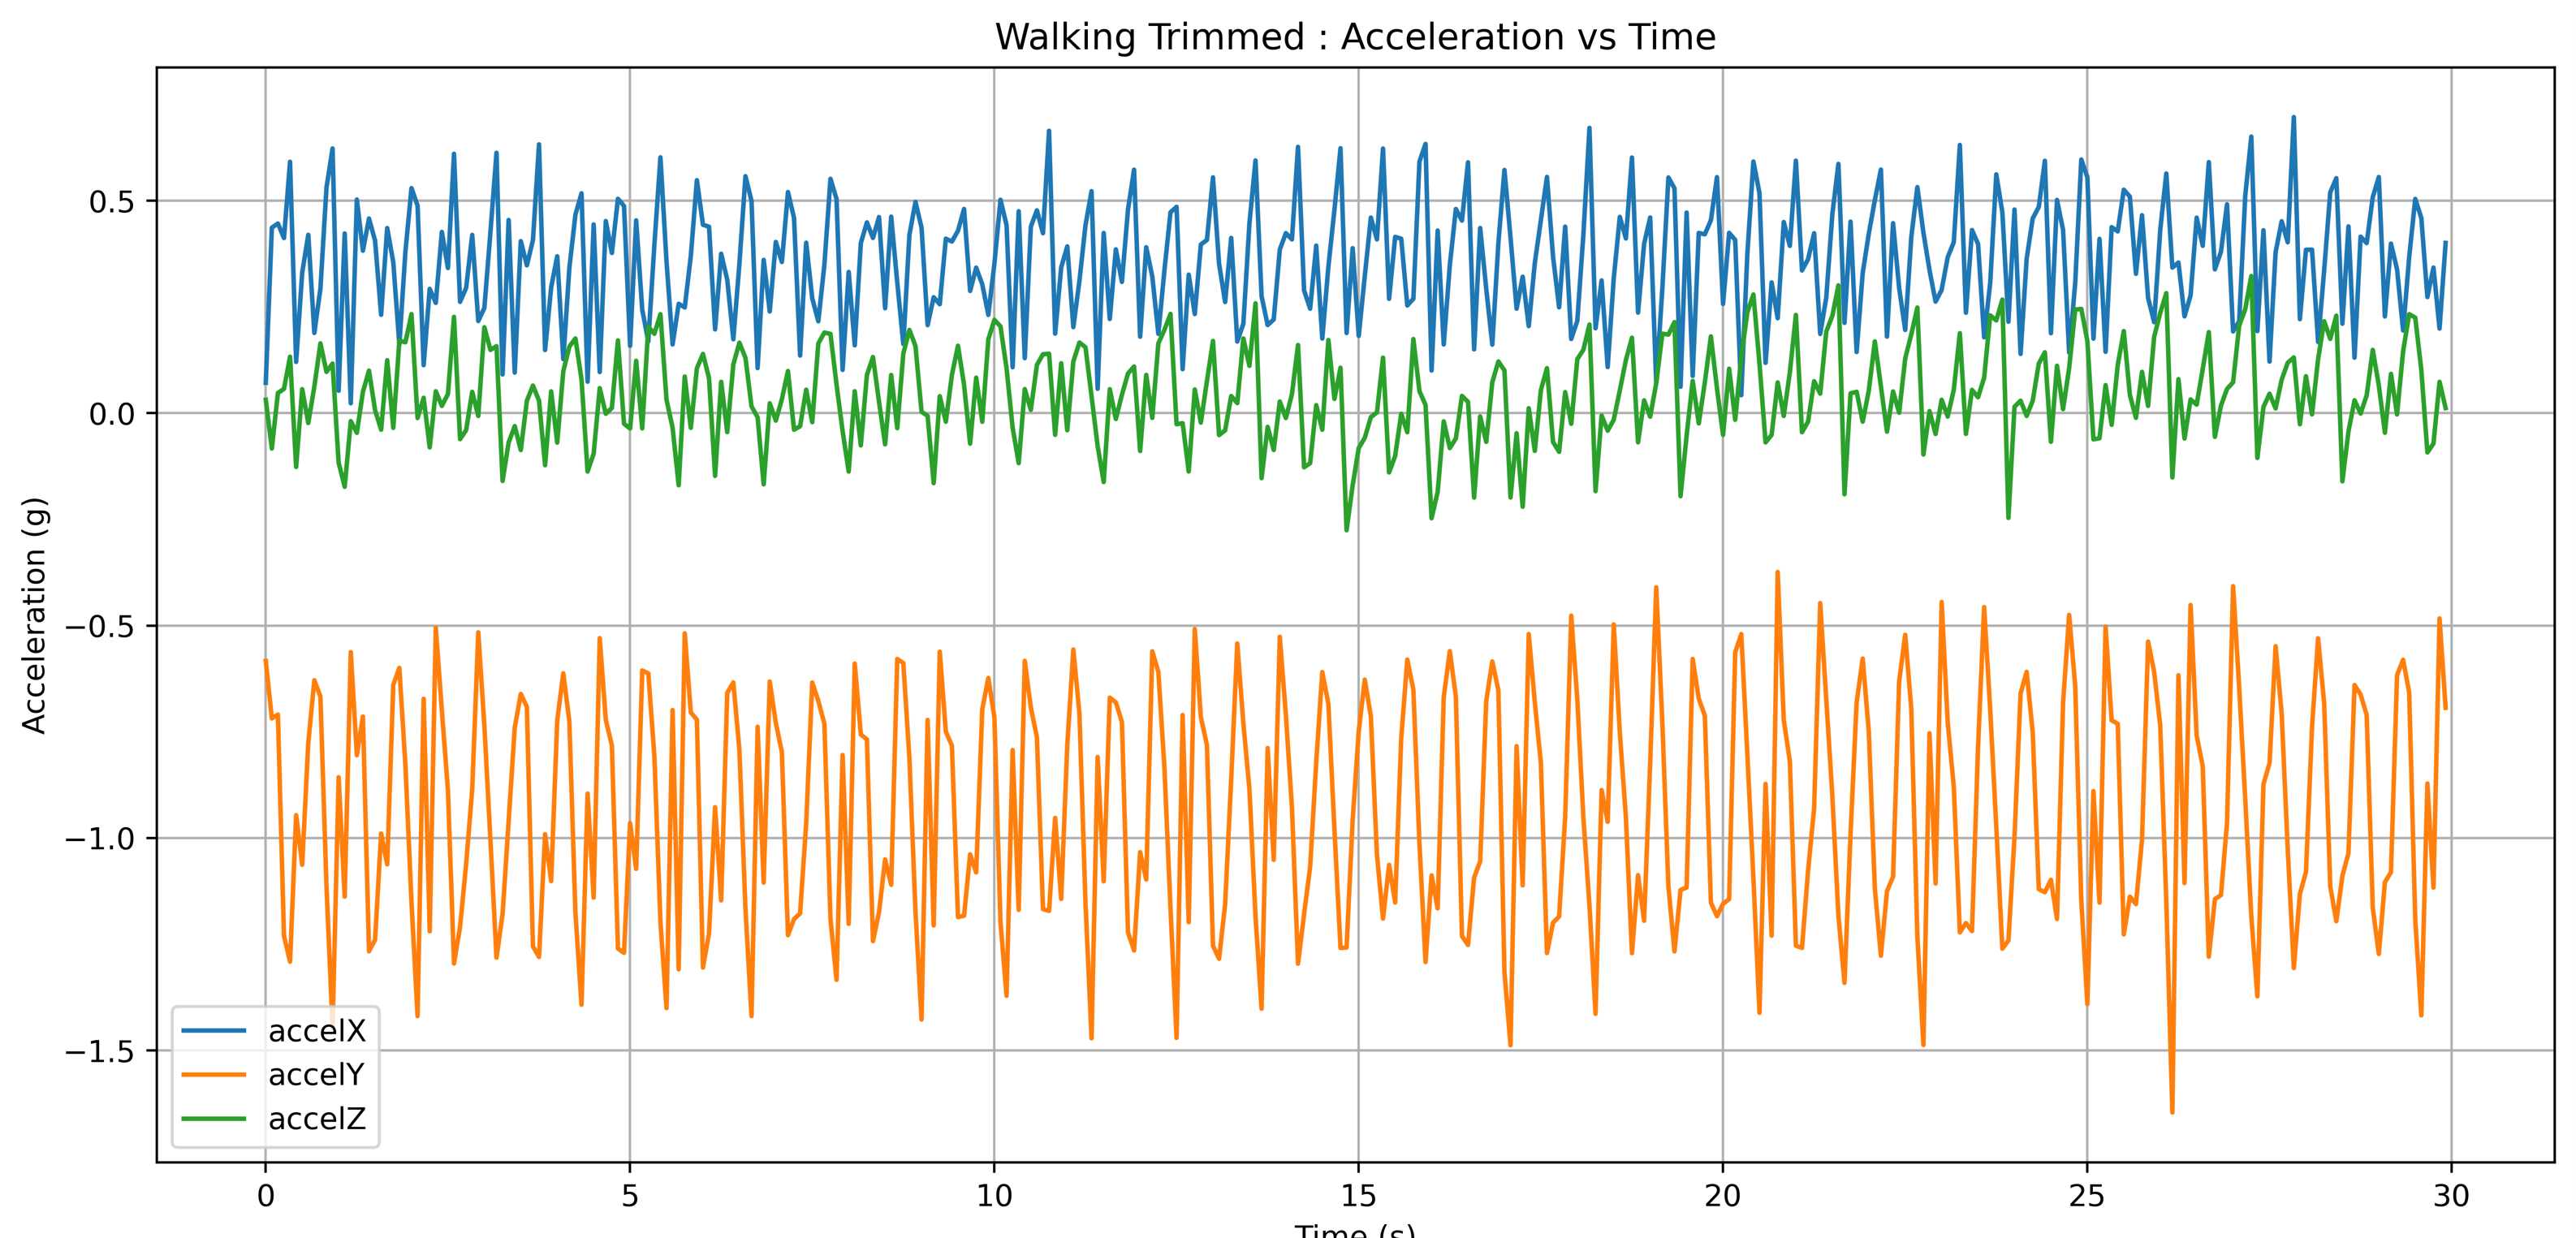
Each activity imprints a distinct pattern in the three-axis acceleration signal, which is the foundation for classification. Standing (Fig. 1) is the simplest case: all three axes are nearly constant, reflecting static gravitational loading with negligible dynamic component. Walking (Fig. 2) introduces a rhythmic oscillation at roughly 1.5–2 Hz, visible across all axes with a characteristic anti-phase relationship between the vertical and anterior axes due to the heel-strike cycle.
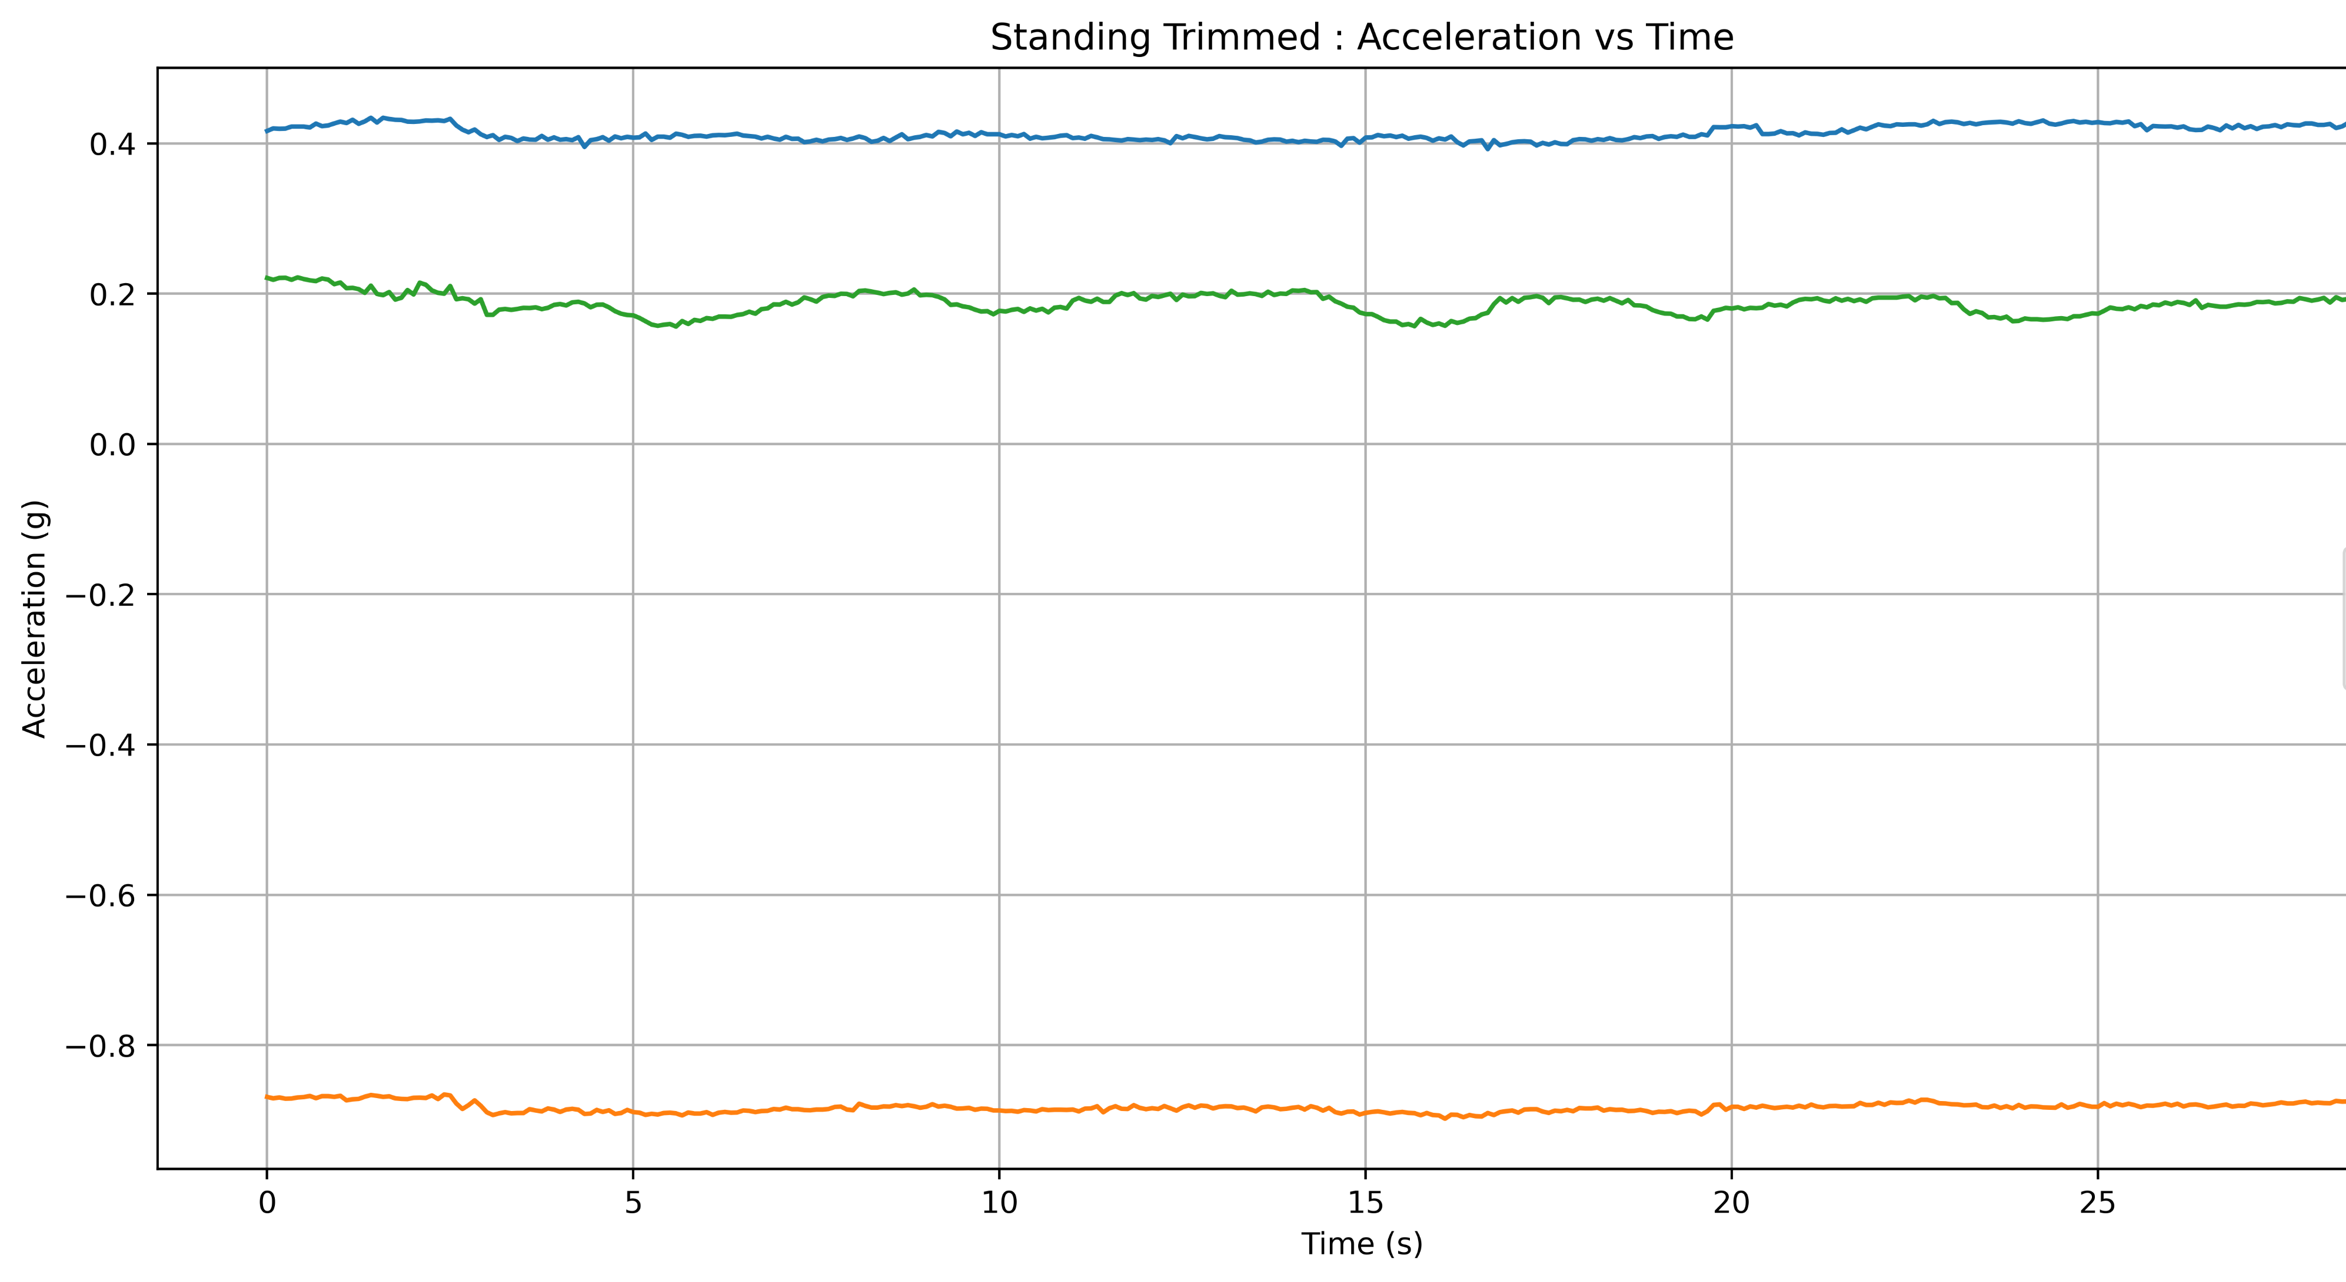
Standing trimmed: accelX, accelY, accelZ all nearly flat over 30 s
Fig. 1. Standing. All three axes are quasi-static: the sensor rests in a fixed orientation against gravity, producing near-zero dynamic component. This low-variance signature is the reference baseline for other static activities.
Walking trimmed: accelX, accelY, accelZ showing rhythmic ~1.5 Hz oscillation
Fig. 2. Walking. Rhythmic oscillation at ~1.5–2 Hz is visible across all three axes (accelX: blue, accelY: orange, accelZ: green). The anti-phase relationship between axes reflects chest motion during the heel-strike gait cycle.

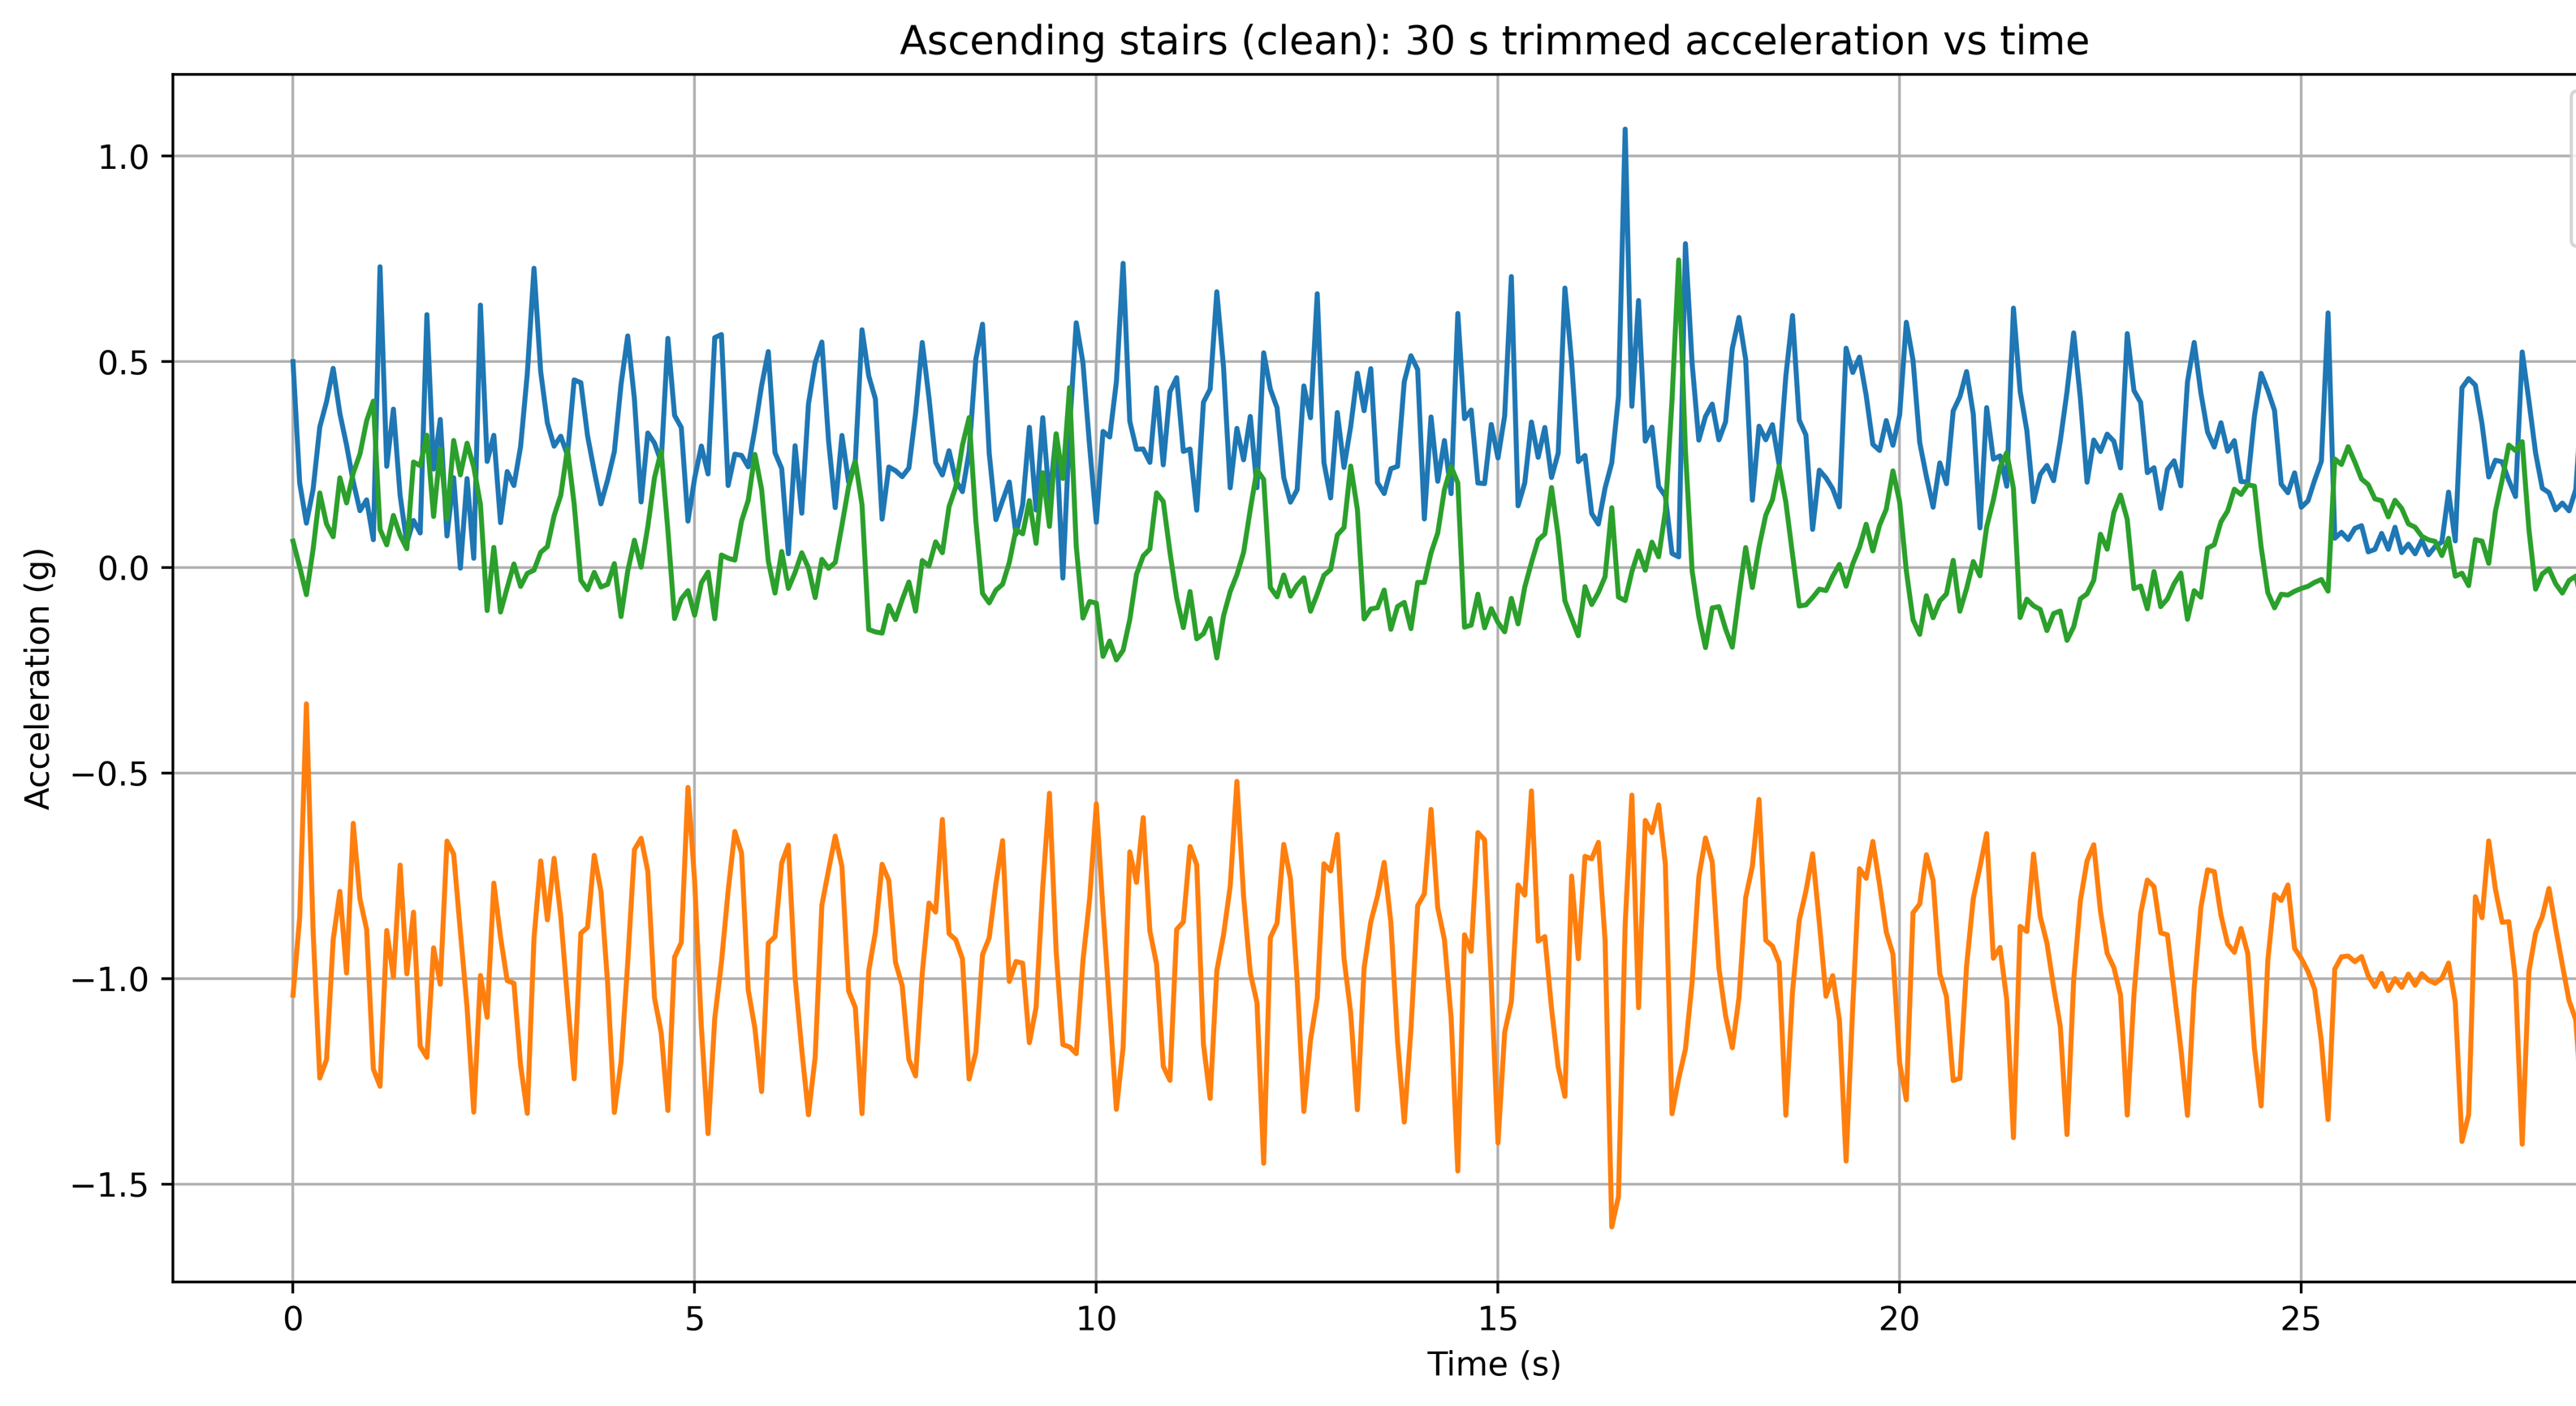
Running (Fig. 3) produces a dramatically different signature from walking: the amplitude is two to three times larger and the dominant frequency shifts upward to 2.5–4 Hz. The three axes are more tightly correlated in phase, reflecting the more vertical and symmetric impact of the running stride on the chest. Stair ascending (Fig. 4) resembles walking in rhythm but is asymmetric — the accelZ (vertical) component has an intermittent elevation transient corresponding to the step-up impulse, and the overall envelope is less regular than level walking.
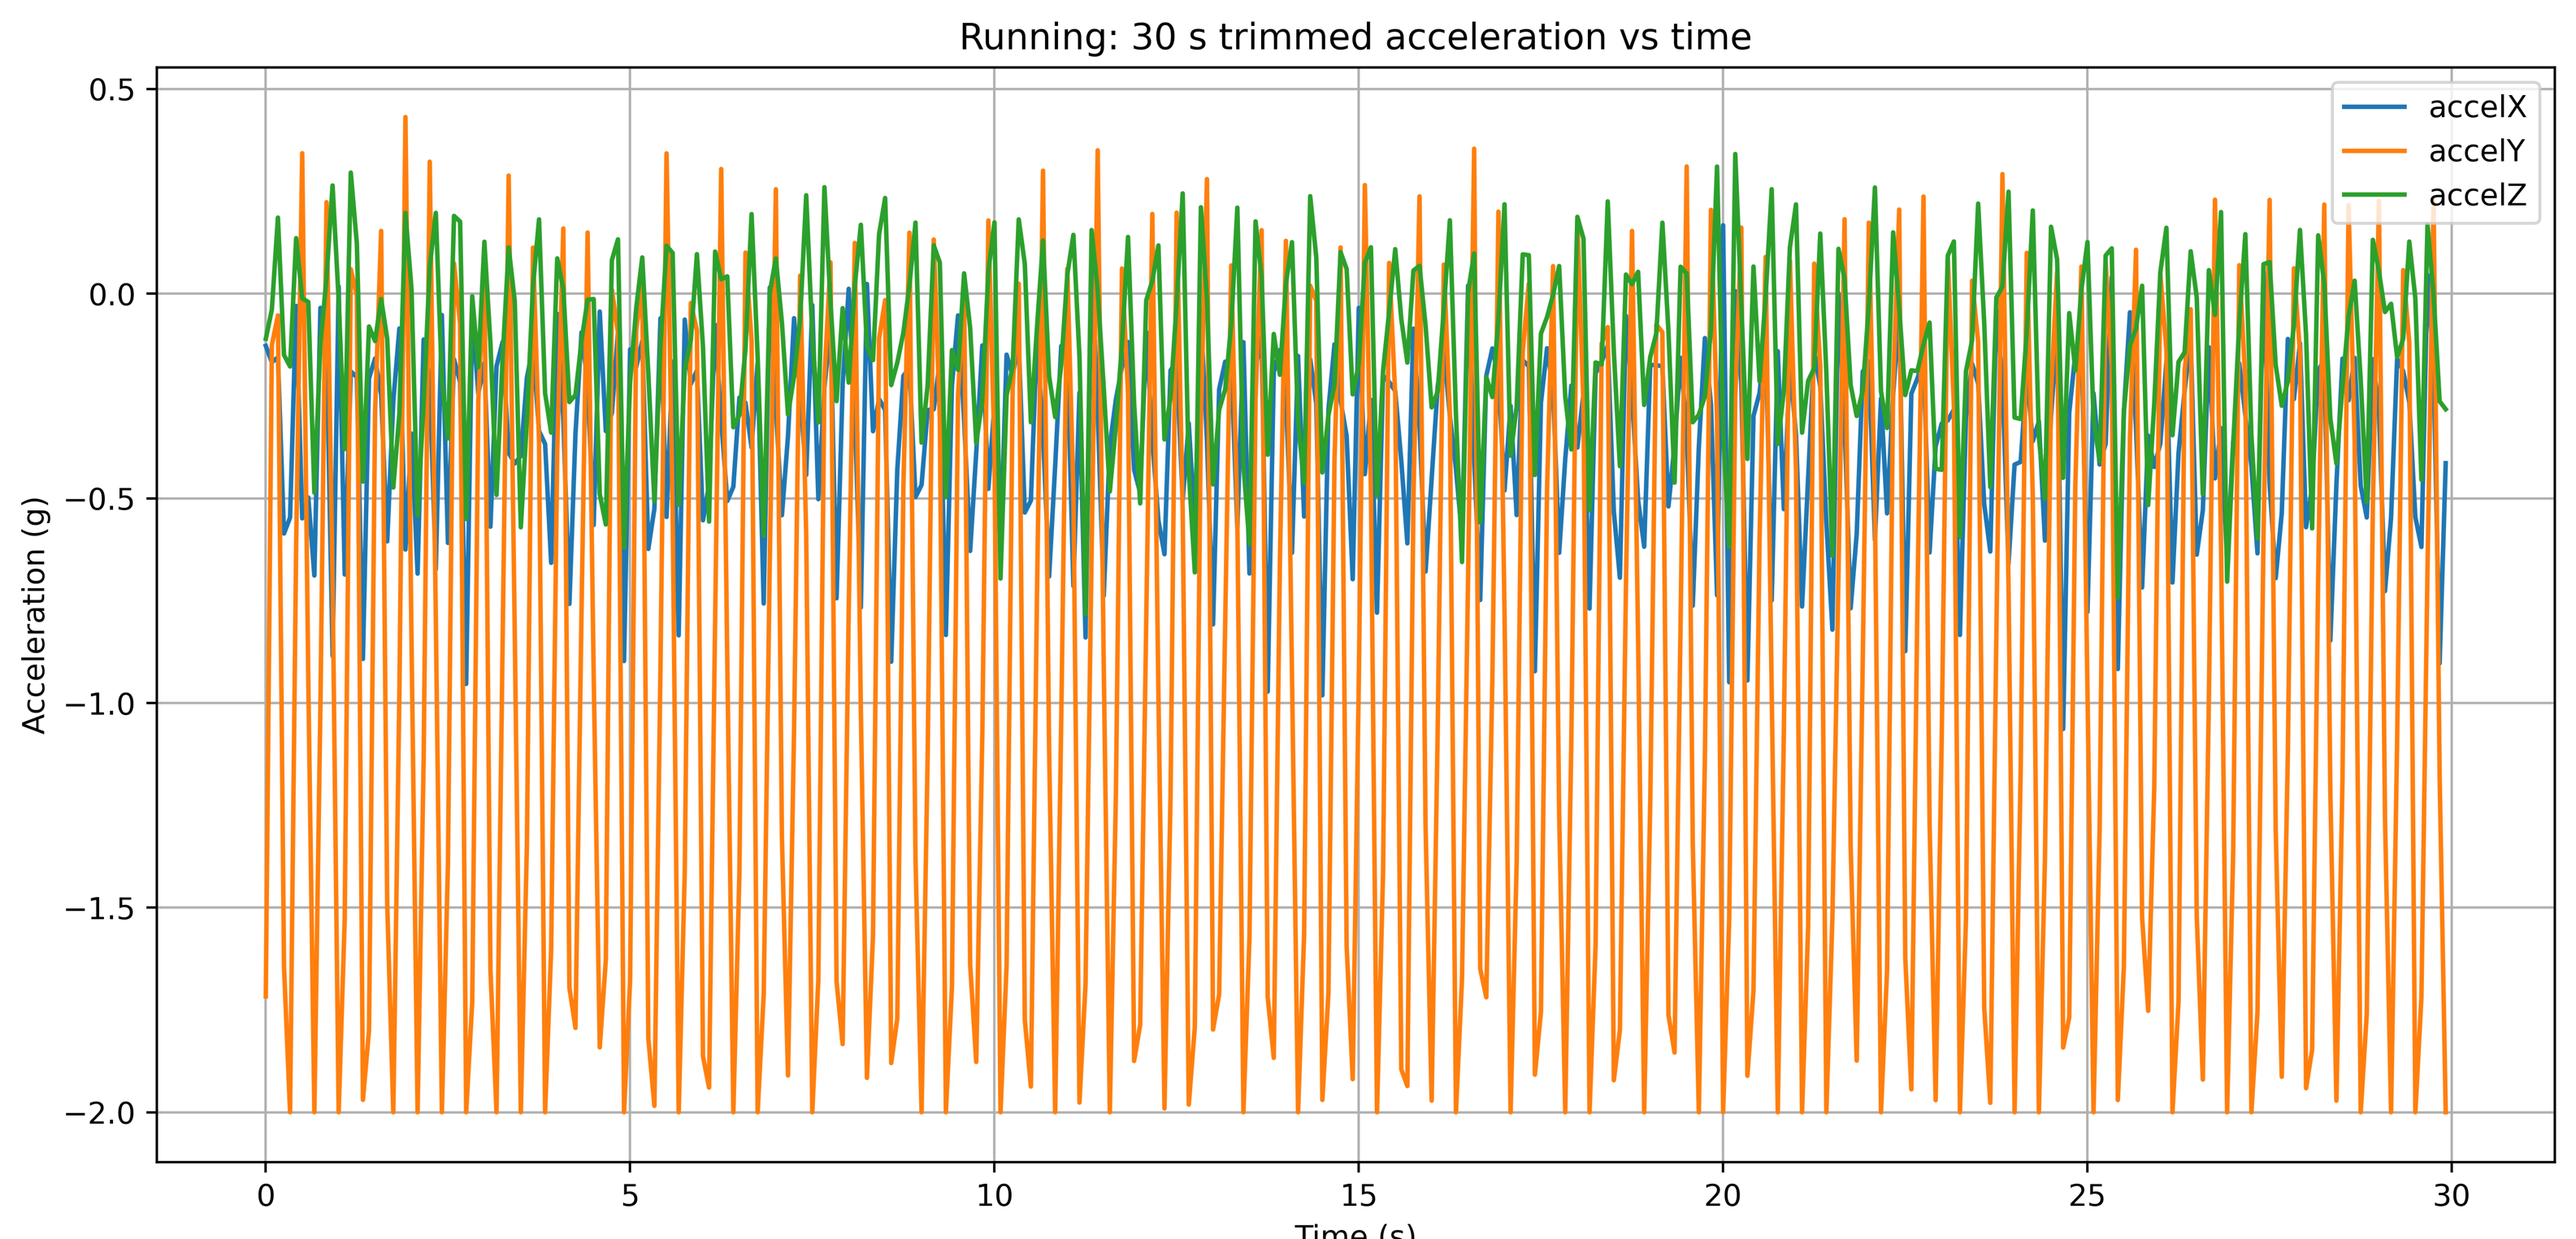
Running: high-amplitude dense oscillation 2.5-4 Hz across all axes
Fig. 3. Running. Amplitude 2–3× larger than walking, with dominant frequency near 3 Hz. All three axes oscillate nearly in phase, reflecting the symmetric vertical impact of the running stride. Peak accelerations reach ±2 g.
Ascending stairs: irregular oscillation with intermittent elevation transients
Fig. 4. Ascending stairs. Rhythm similar to walking (~1.5 Hz) but with irregular amplitude envelope caused by step-up impulses. The staircase contact pattern introduces asymmetry absent in level walking, making this class harder to separate from walking.

Feature Engineering

Rather than feeding raw windows directly to a neural network, the classifier study extracts a rich set of handcrafted features per window to make the class boundaries interpretable. Each 50-sample window produces two feature groups:

Time-domain features capture the statistical properties of each axis and of the signal magnitude |a| = √(ax² + ay² + az²): mean, standard deviation, RMS, peak-to-peak, min, max, skewness, and step-rate estimates derived from peak counting on the magnitude signal. The jerk vector j = da/dt is also computed, providing features sensitive to impulse events (heel-strikes, step-ups) that are less visible in the acceleration itself.

Frequency-domain features include the dominant frequency and band-power estimates at several physiologically motivated bins (0.3–1, 1–2.5, 2.5–5 Hz) computed from the FFT of the magnitude signal. Spectral entropy is also included to capture the regularity of the motion spectrum — running has a clean, peaky spectrum while miscellaneous movements are spectrally diffuse.
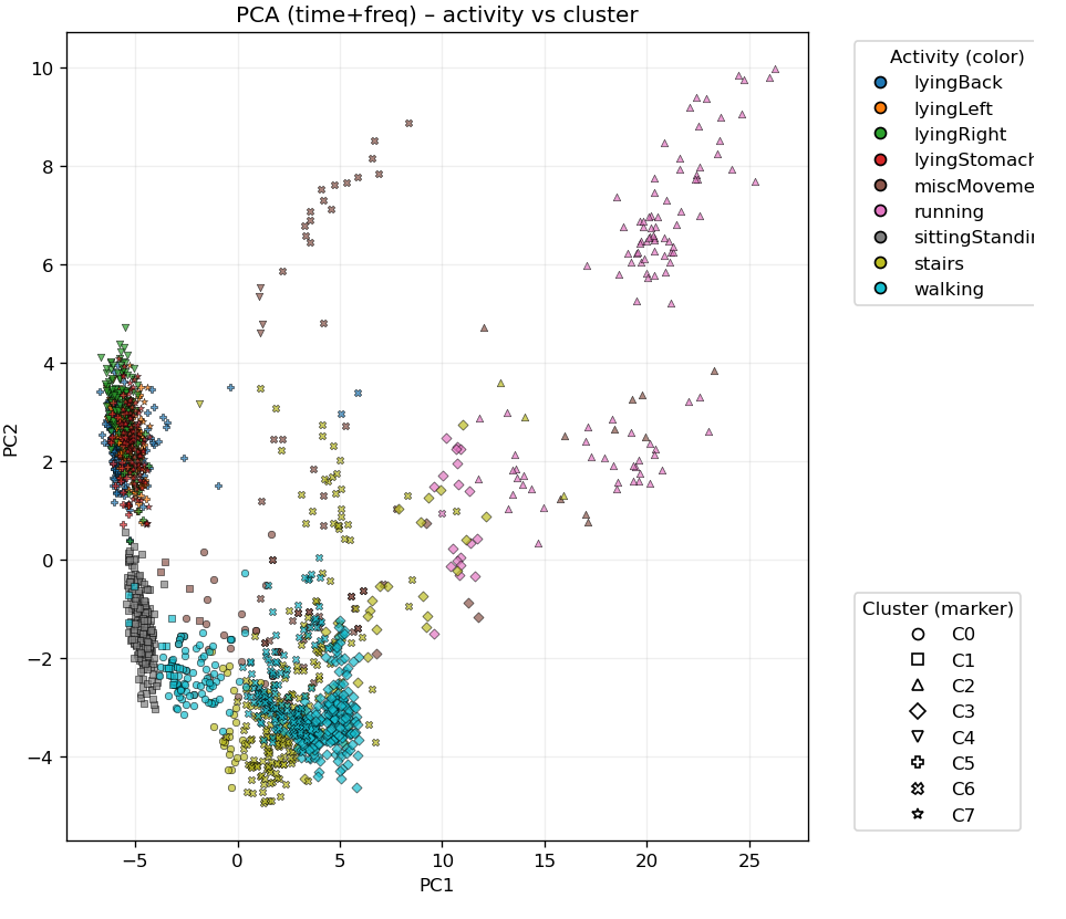
PCA scatter of time+frequency features coloured by activity label and shaped by cluster
Fig. 5. PCA projection of the combined time+frequency feature set (first two principal components), coloured by ground-truth activity label and shaped by unsupervised cluster assignment. Running (red) and static activities (lying variants, sitting, standing) form compact, well-separated clusters. Locomotion activities (walking, stairs, shuffling) overlap more in the PCA projection, motivating the two-stage hierarchical design.

Single-Stage Classifier Comparison

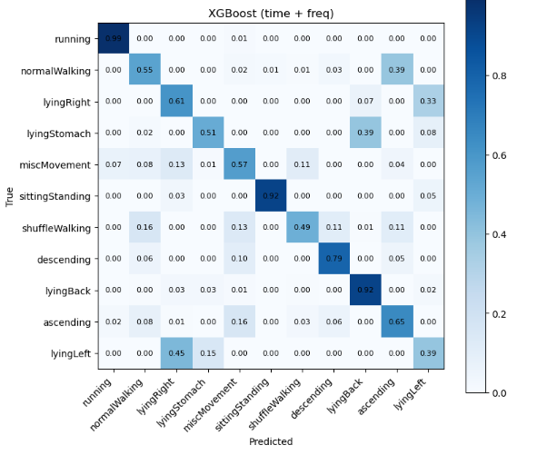
Three single-stage classifiers were trained on the full feature set and compared via normalised confusion matrices on a held-out test set: Random Forest, XGBoost, and SVM with an RBF kernel. All three were evaluated on the full set of fine activity labels without any hierarchical grouping.
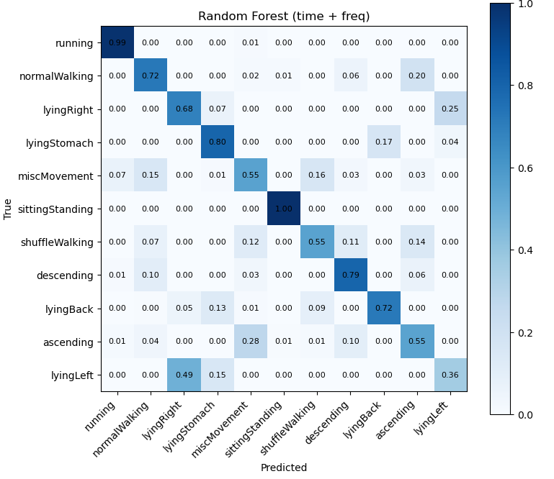
Random Forest confusion matrix for full activity labels
Fig. 6. Random Forest (time+freq features). High accuracy for running, lying variants, and static activities. Confusion concentrated between normal walking and stair/shuffling classes, and between lying postures.
XGBoost confusion matrix for full activity labels
Fig. 7. XGBoost (time+freq features). Slightly better separation than Random Forest on the locomotion sub-group, but similar overall pattern: running and static activities are near-perfectly classified while within-locomotion and within-static confusions remain.
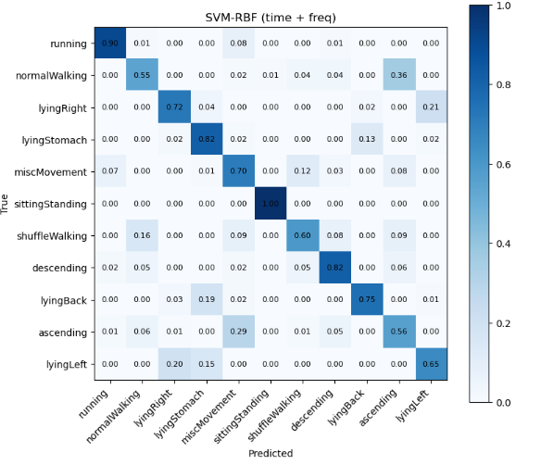
SVM-RBF confusion matrix for full activity labels
Fig. 8. SVM with RBF kernel (time+freq features). Performance broadly comparable to XGBoost on most classes. The SVM shows slightly higher confusion on the lying-posture sub-group compared to the tree-based models, likely due to the marginal geometry of the separating hyperplane for those classes.

Two-Stage Hierarchical Classifier

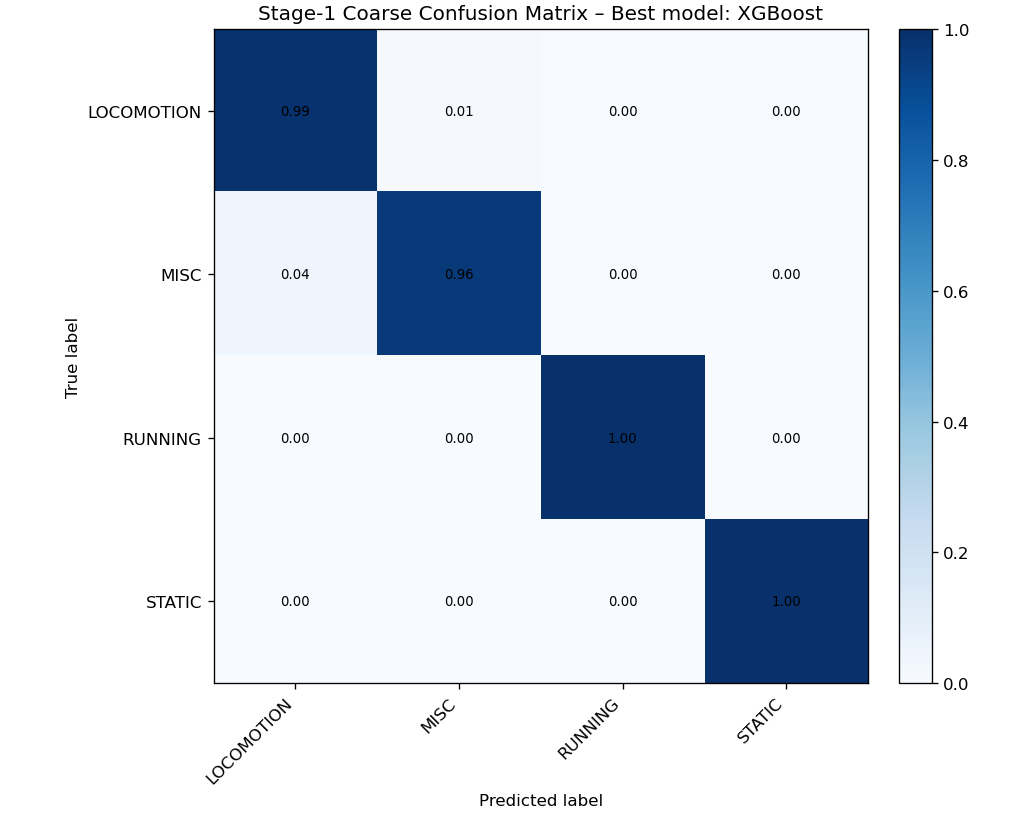
Motivated by the PCA structure (Fig. 5), which shows clear macro-level separation before fine-level distinctions, a two-stage hierarchical approach was developed. Stage 1 trains a coarse classifier that groups all activities into four broad super-classes: STATIC (sitting, standing, all lying postures), LOCOMOTION (walking, stair variants, shuffling), RUNNING, and MISC (miscellaneous movements). Stage 2 trains a separate fine-grained classifier within each coarse group, so that the inter-group margins learned at Stage 1 are not competing with the harder within-group distinctions at Stage 2.
Stage-1 coarse confusion matrix: LOCOMOTION, MISC, RUNNING, STATIC with XGBoost
Fig. 9. Stage-1 coarse confusion matrix (XGBoost, best coarse model). RUNNING and STATIC are classified with near-perfect accuracy (1.00). LOCOMOTION achieves 0.99 correct; MISC has a small 4% spillover into LOCOMOTION, which is the most similar macro-group dynamically.
Stage-1 coarse feature importances: j_mag_std dominant, then a_mag_rms, j_mag_rms
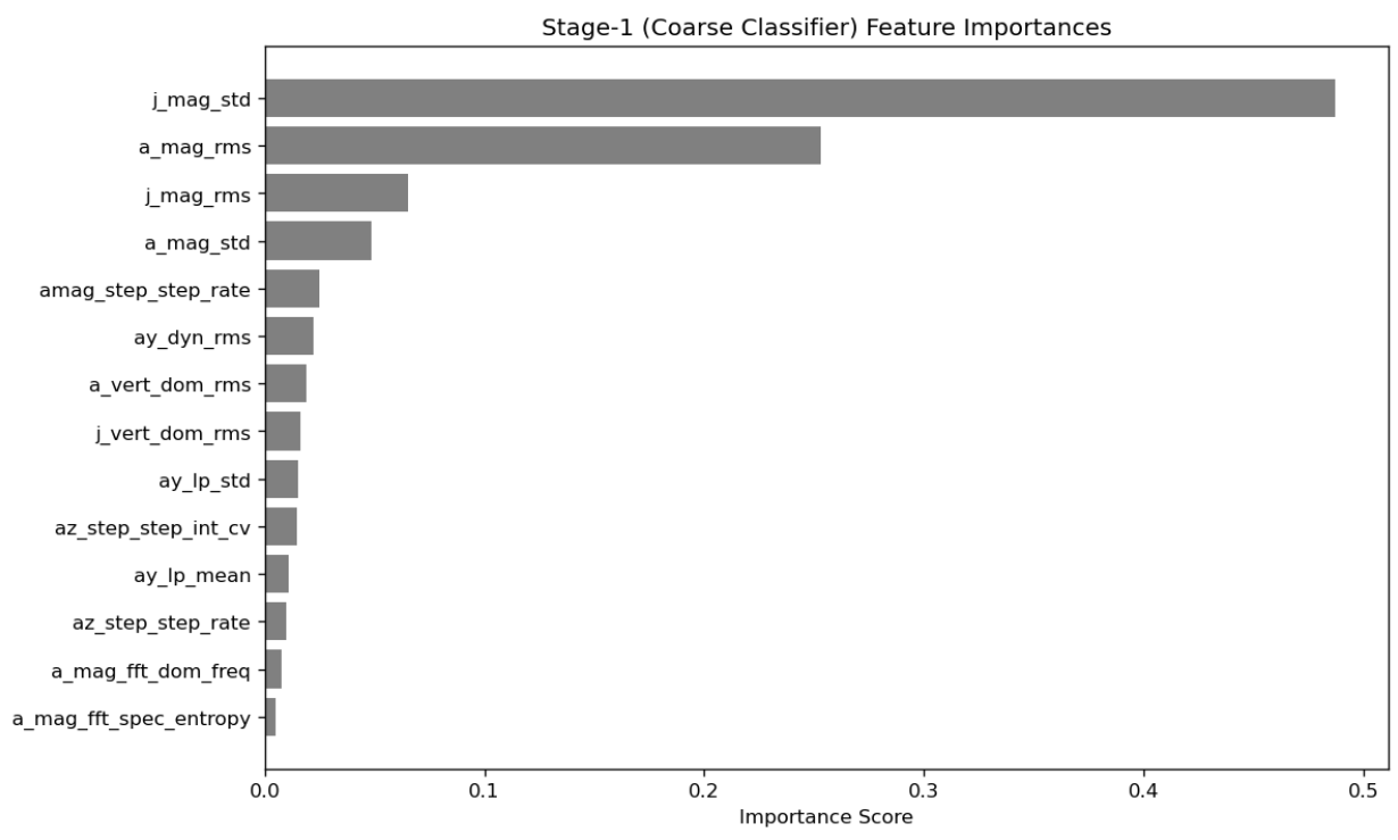
Fig. 10. Stage-1 (coarse) classifier feature importances. Jerk magnitude standard deviation (j_mag_std) is the single most important feature by a large margin, reflecting the step-impulse intensity difference between static and locomotion activities. Acceleration magnitude RMS (a_mag_rms) is the second most important, capturing overall motion intensity.

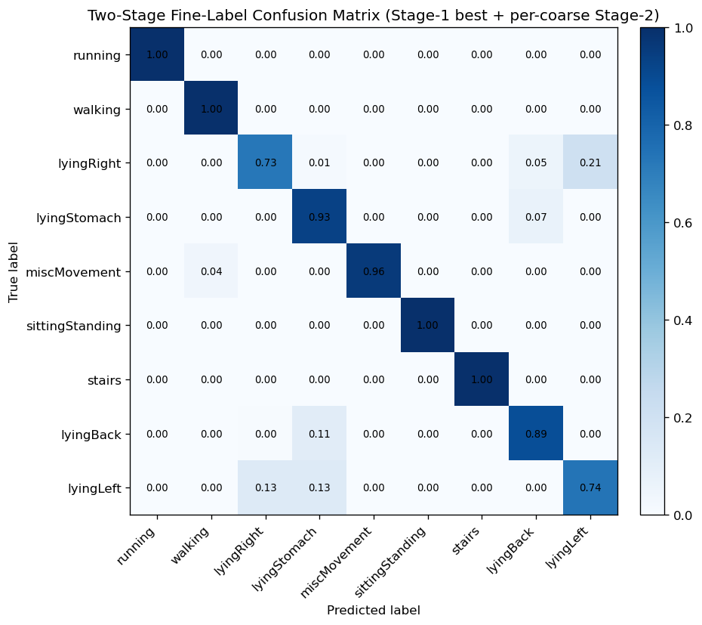
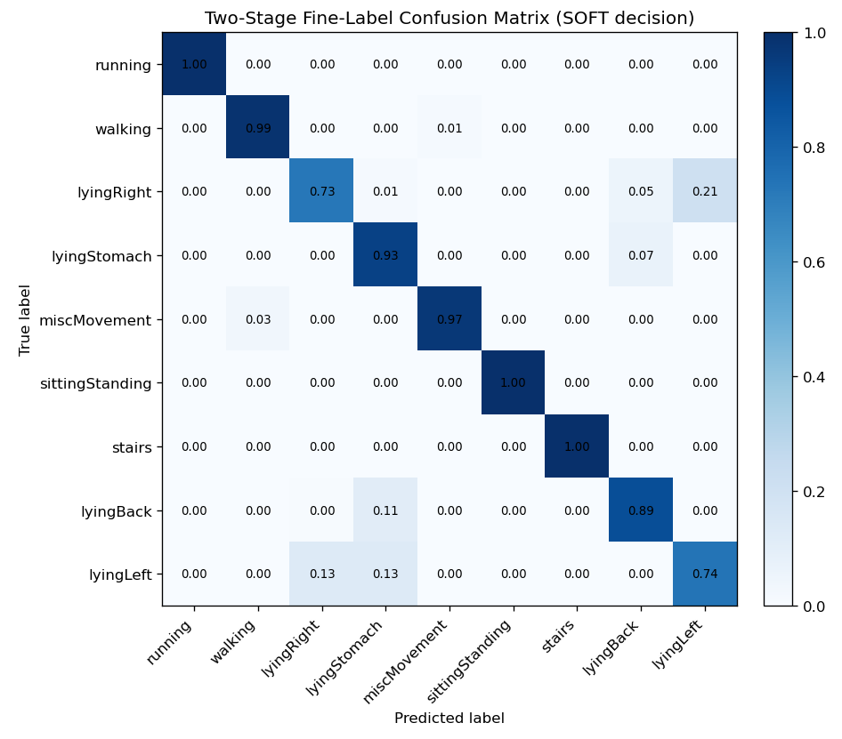
The fine-label Stage-2 classifiers operate only within their coarse group, so they are trained on a much cleaner sub-problem. Fig. 11 shows the Stage-2 fine-label confusion matrix using hard routing (every sample takes whichever Stage-1 coarse label is most probable). Fig. 12 shows the soft-decision variant, where Stage-1 posterior probabilities are used to weight the contributions of each Stage-2 model, producing smoother confusion at coarse boundaries.
Two-stage fine-label confusion matrix, hard decision routing
Fig. 11. Two-stage fine-label confusion matrix (hard Stage-1 routing). Overall diagonal dominance is strong; residual confusion is mainly concentrated between lying postures (lyingLeft, lyingRight, lyingBack, lyingStomach) and between walking variants (normal walking, shuffling, stairs).
Two-stage fine-label confusion matrix, soft decision routing
Fig. 12. Two-stage fine-label confusion matrix (soft Stage-1 routing, Stage-1 posteriors used to weight Stage-2 outputs). The soft variant reduces hard misclassifications near coarse boundaries (e.g. MISC vs LOCOMOTION) and improves the overall diagonal, particularly for the miscMovement class.

Stage-2 Feature Importances

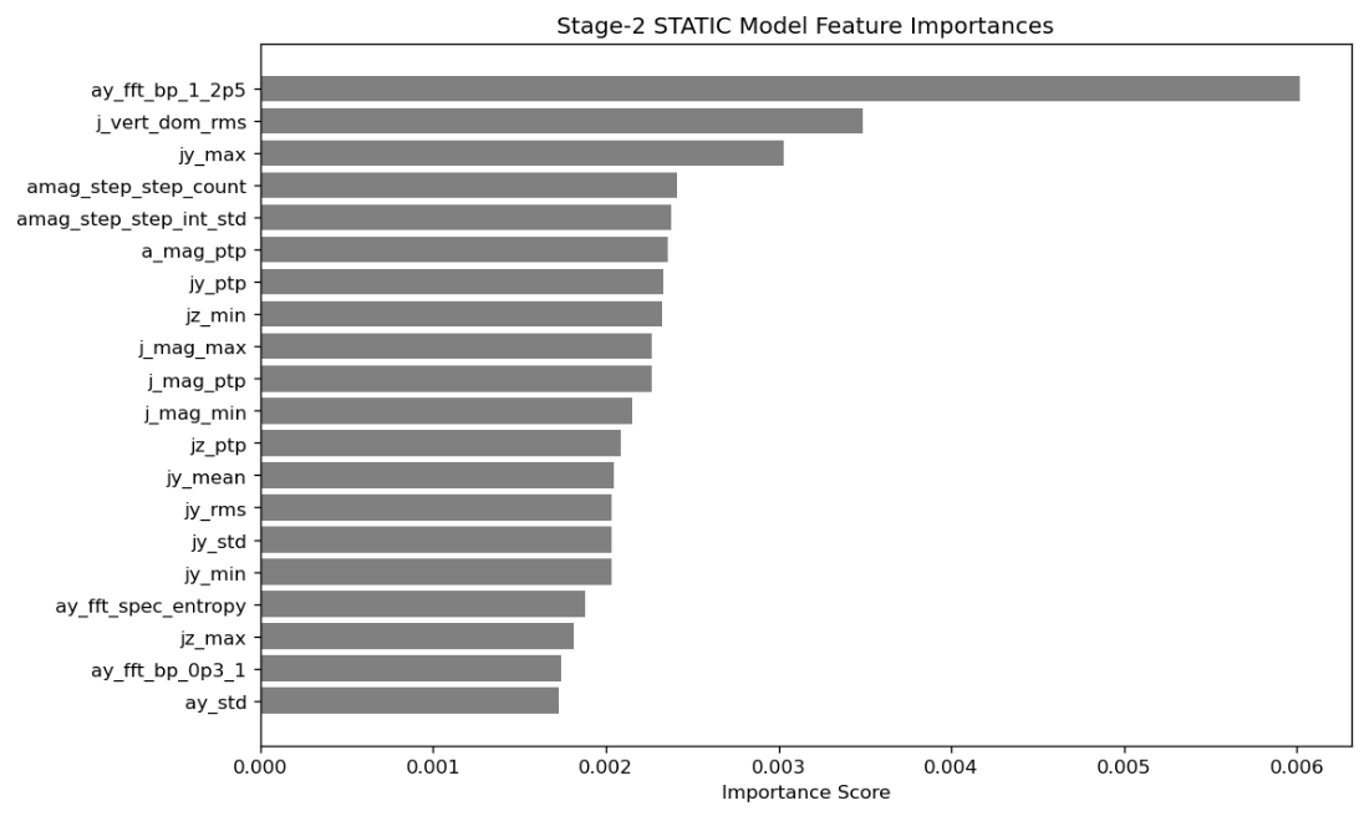
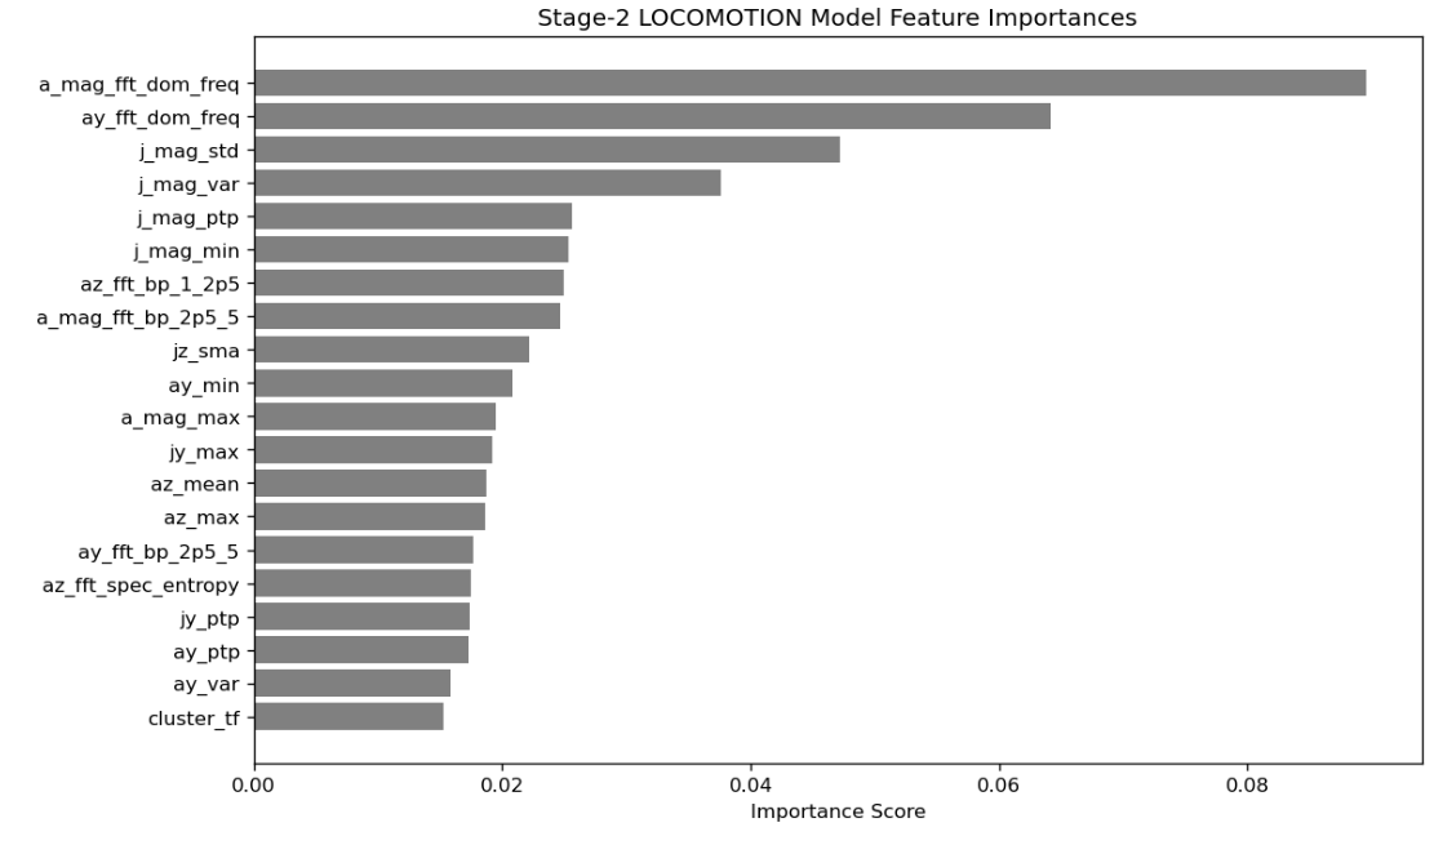
The per-group Stage-2 models learn different feature rankings depending on the discrimination problem within each coarse class. For the STATIC group (sitting, standing, multiple lying postures), the dominant feature is the low-frequency band-power of the y-axis FFT (ay_fft_bp_1_2p5), reflecting the subtle postural differences in chest inclination angle between sitting, standing, and lying orientations (Fig. 13). For the LOCOMOTION group (walking, stairs, shuffling), dominant frequency features (a_mag_fft_dom_freq, ay_fft_dom_freq) and jerk statistics are most discriminative (Fig. 14) — locomotion sub-classes differ primarily in step cadence and impact asymmetry rather than in overall amplitude.
Stage-2 STATIC model feature importances: ay_fft_bp_1_2p5 dominant
Fig. 13. Stage-2 STATIC sub-classifier feature importances. The dominant feature is low-frequency y-axis band-power, capturing the gravity projection differences between sitting, standing, and lying orientations. Jerk-based features are also informative for distinguishing transitions (sitting-to-standing) from fully static states.
Stage-2 LOCOMOTION model feature importances: a_mag_fft_dom_freq dominant
Fig. 14. Stage-2 LOCOMOTION sub-classifier feature importances. Dominant frequency of acceleration magnitude is the top feature, distinguishing the staircase step rate from level-walking cadence and shuffling. Jerk variance and magnitude statistics follow, reflecting impact intensity differences.

Ensemble and Final Performance

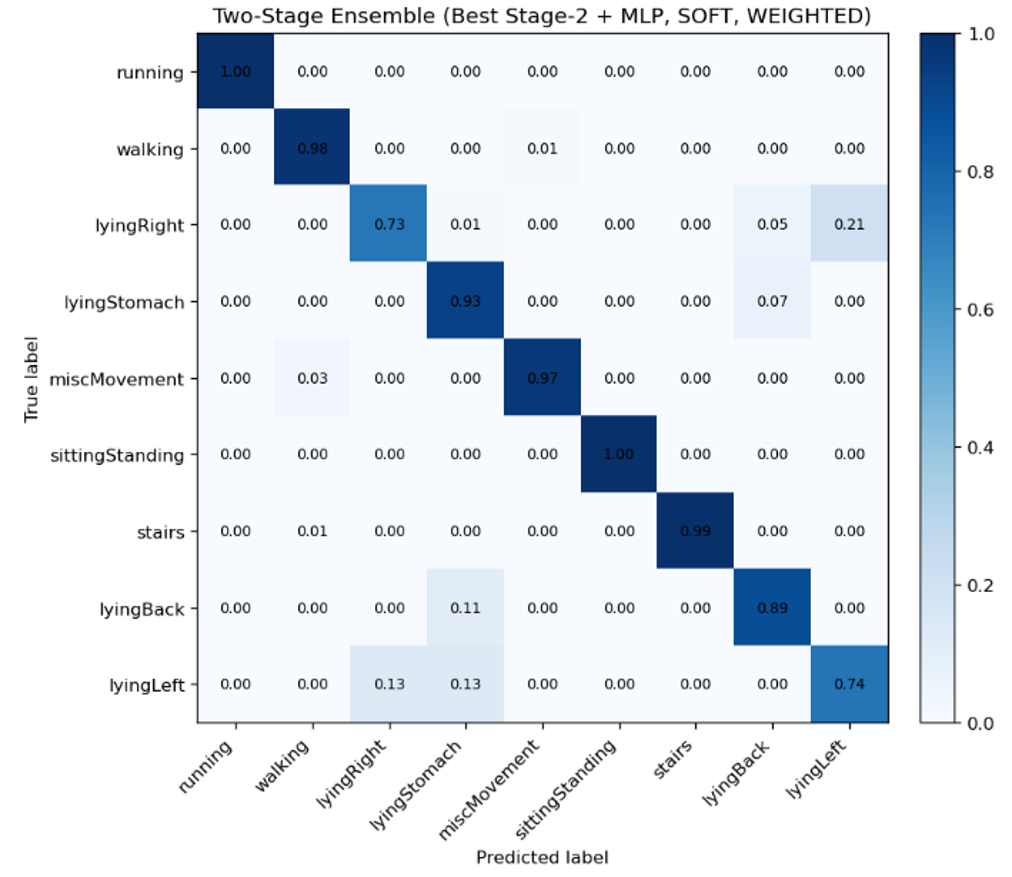
The final classifier combines the best Stage-2 model in each coarse group with a Multi-Layer Perceptron (MLP) trained on the full feature set, using soft-weighted ensemble combination. The ensemble confusion matrix (Fig. 15) shows the best overall performance of all systems evaluated. Running and most lying postures are classified with near-zero error; the remaining confusions — primarily within the locomotion group between walking and stair variants — reflect genuine signal similarity at the 12 Hz sampling rate that would likely require higher-frequency or gyroscope features to fully resolve.
Two-stage ensemble (Stage-2 + MLP, SOFT, WEIGHTED) final confusion matrix
Fig. 15. Final ensemble confusion matrix (best Stage-2 per coarse group + MLP, soft-weighted combination). Running, static lying postures, and sitting/standing achieve near-diagonal performance. Residual confusion is concentrated in walking vs. stair variants, which share similar step cadence at 12 Hz.

Long-Recording Inference and Behavioural Analysis

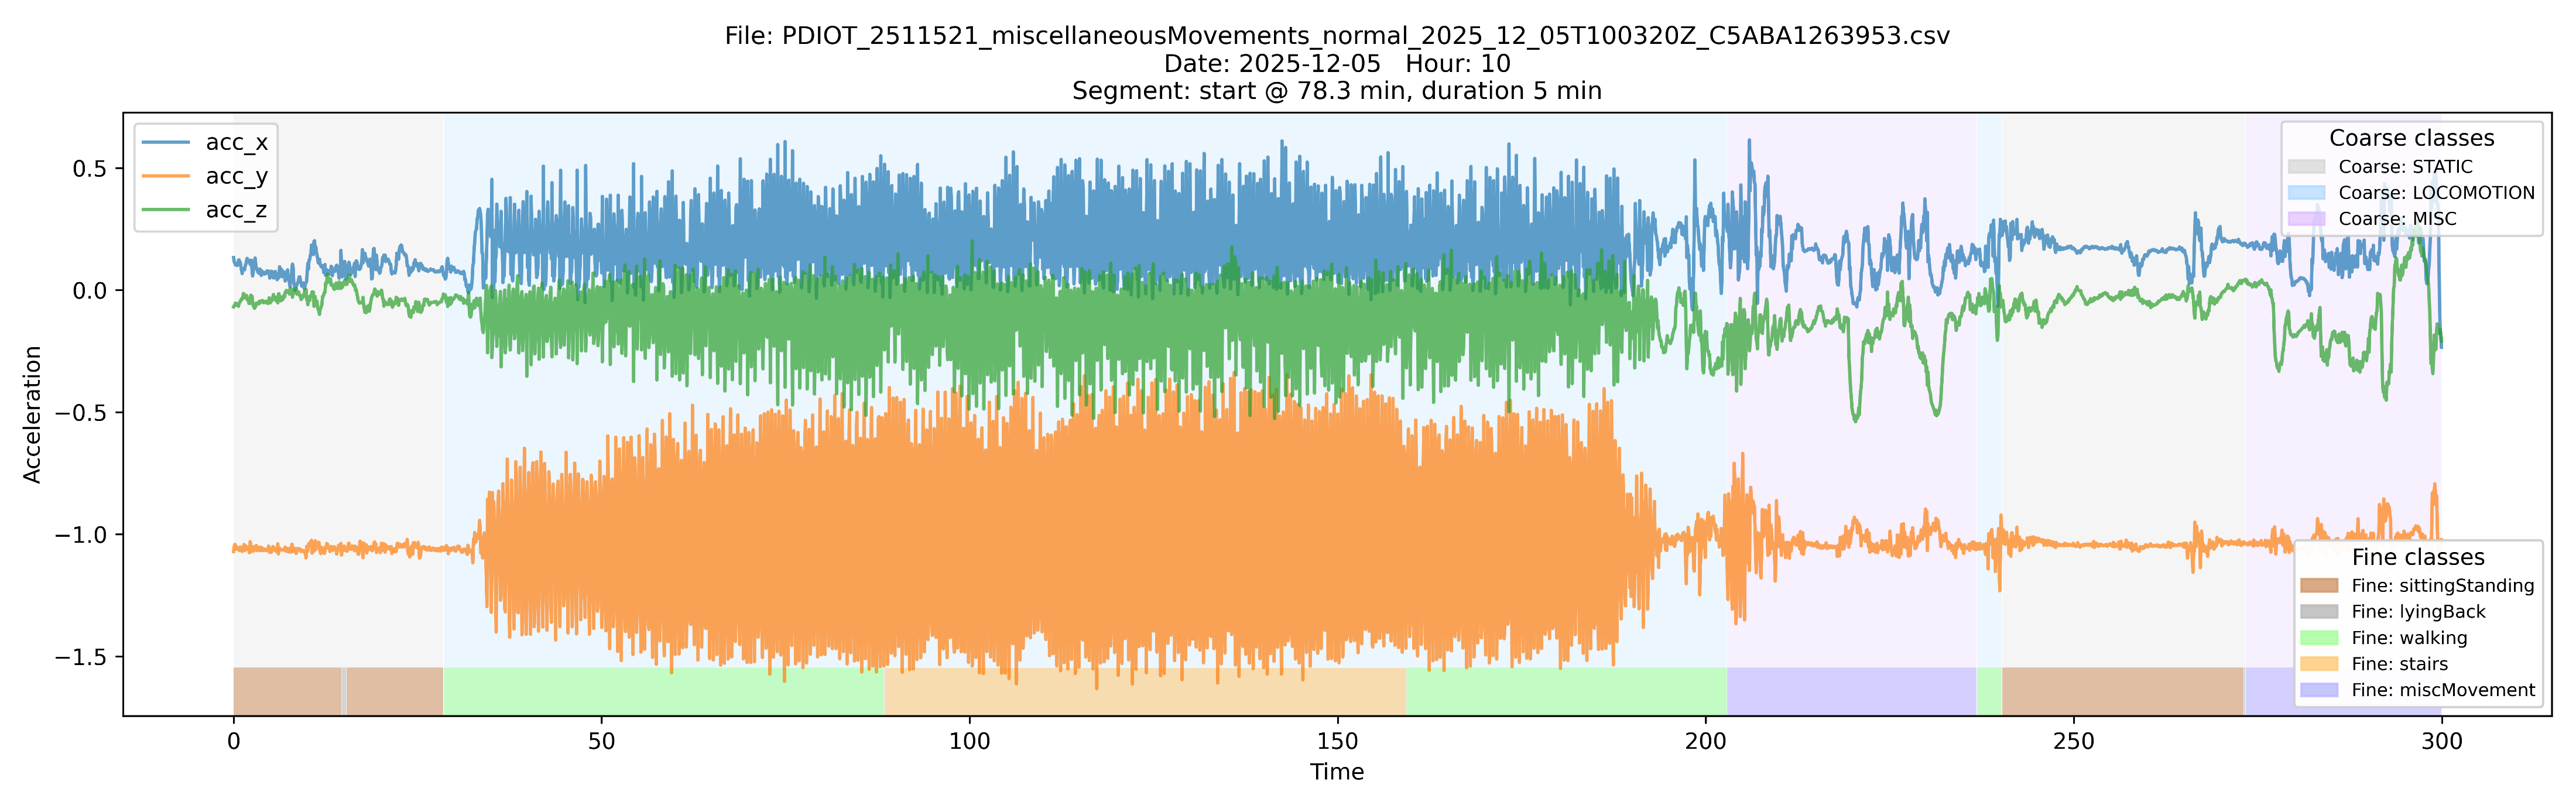
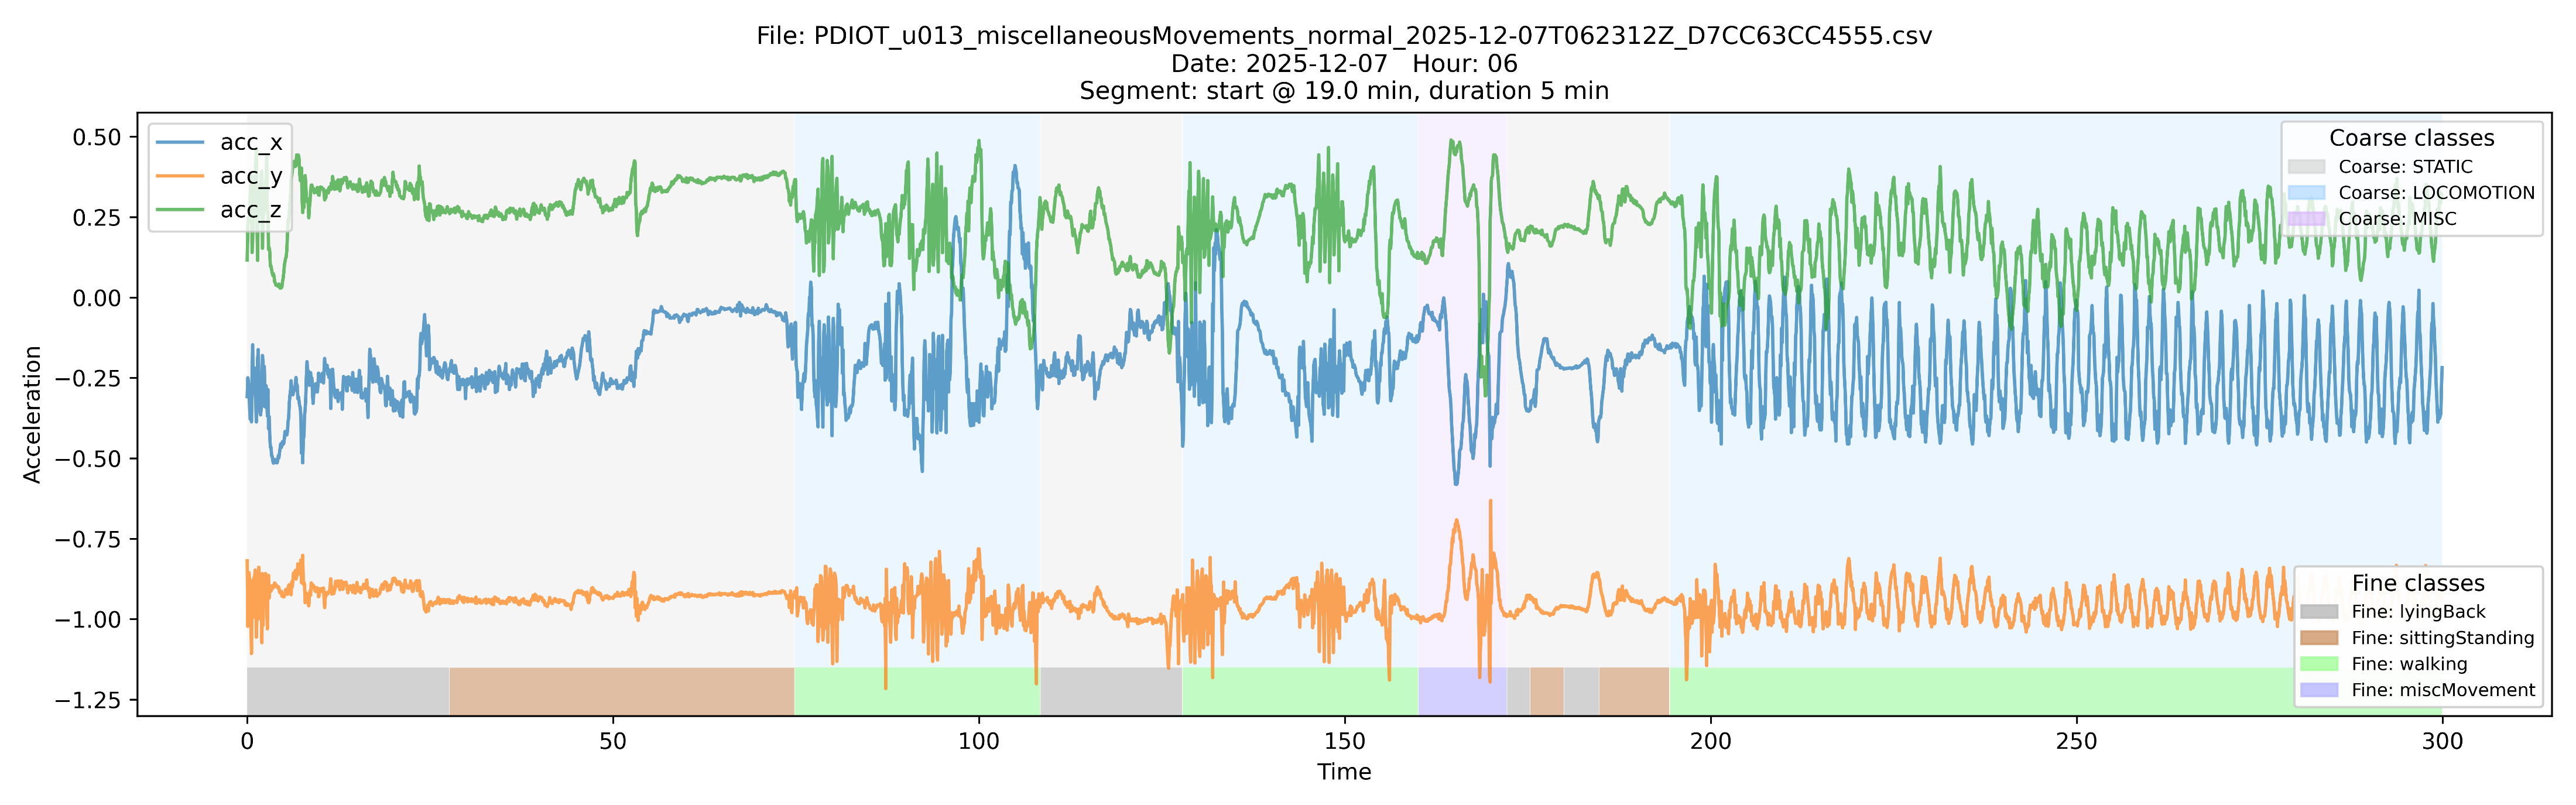
The inference pipeline applies the CNN classifier to multi-hour continuous recordings, producing per-window activity labels that are overlaid on the raw accelerometer signal for qualitative validation. Figures 16–18 show three representative 5-minute segments from three different subjects. The background shading shows the Stage-1 coarse classification (STATIC = grey, MISC = yellow, LOCOMOTION = blue-green) and the fine label (coloured strips at the bottom). The agreement between the raw signal character — flat for static, oscillatory for locomotion — and the predicted labels confirms that the classifier tracks activity transitions correctly even on subjects and recordings not seen during training.
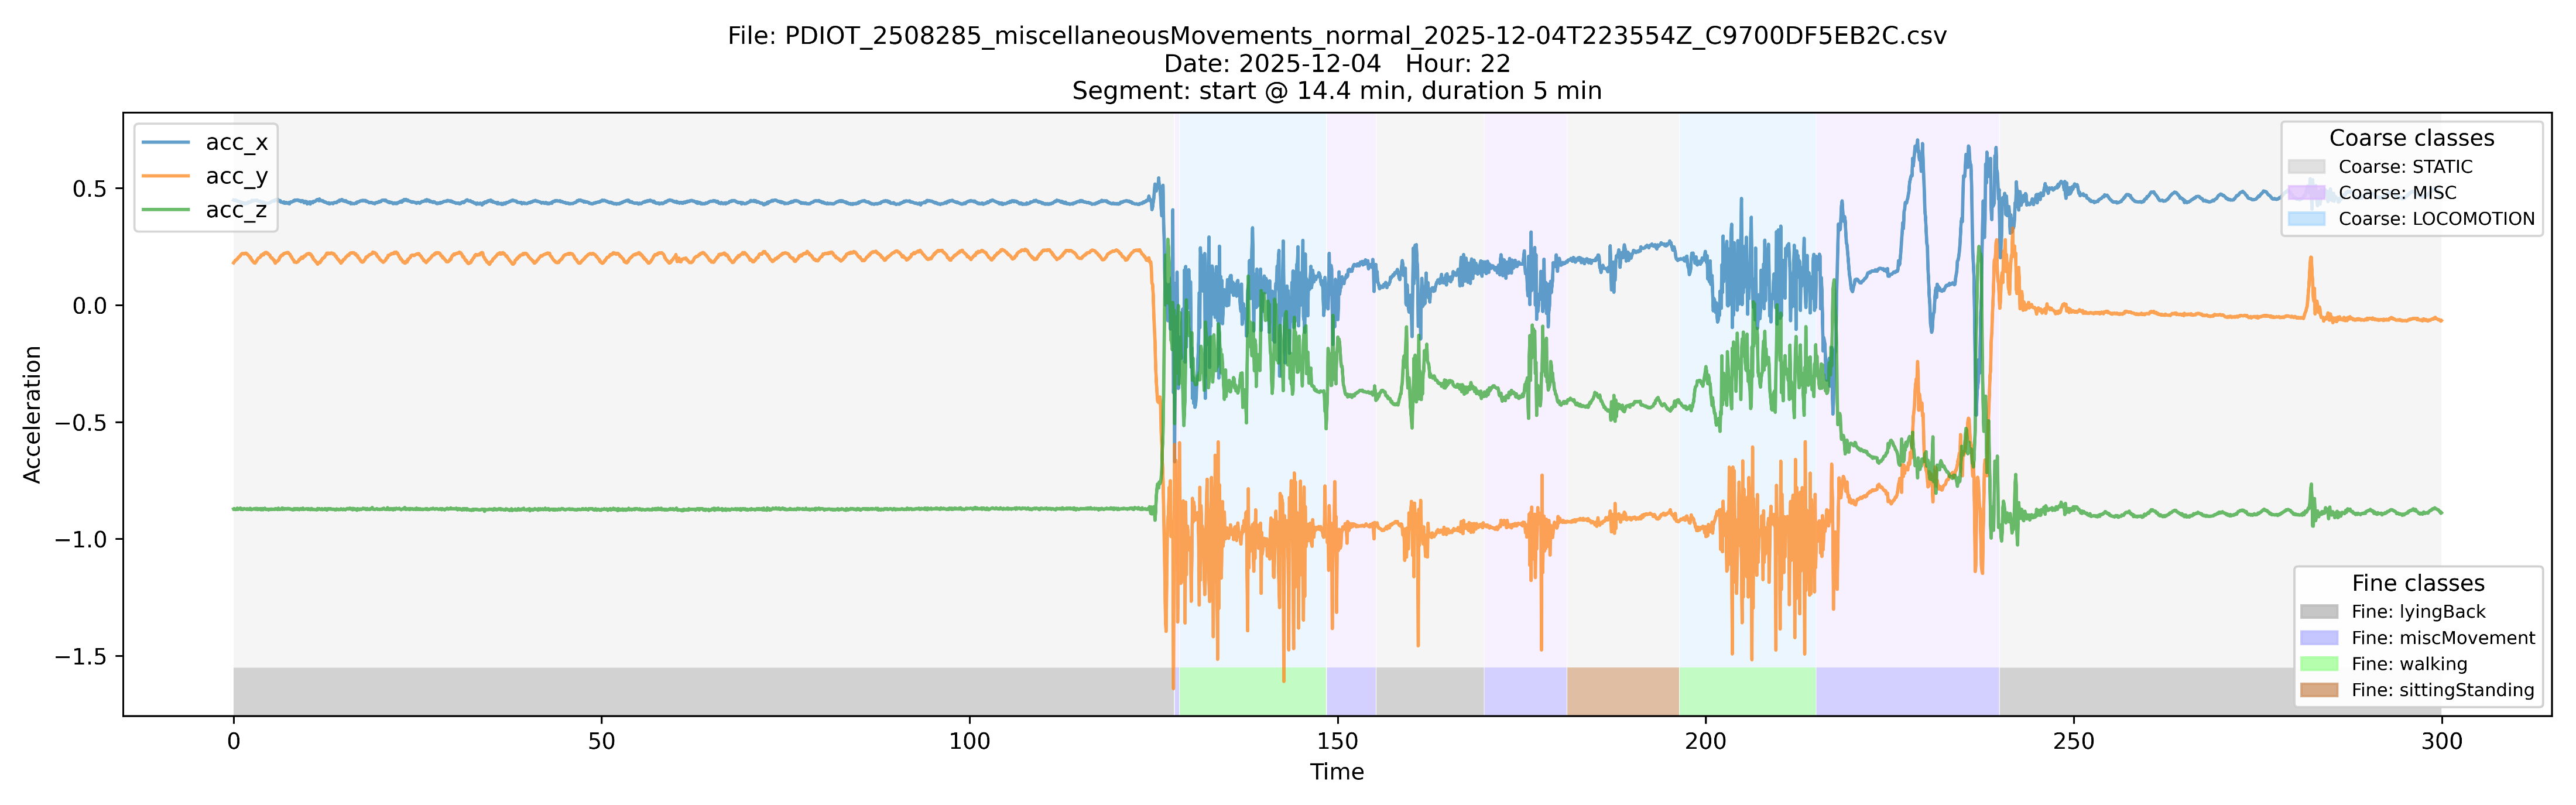
Subject 2508285: 5-minute segment with accelX/Y/Z and coarse+fine activity predictions overlaid
Fig. 16. Inference on a 5-minute segment from subject 2508285. Coarse class shading (background) and fine class strips (bottom) are overlaid on accelX (blue), accelY (orange), accelZ (green). The signal transitions from high-activity locomotion to a quiet static period, correctly tracked by both coarse and fine classifiers.
Subject u013: 5-minute segment with coarse+fine activity predictions overlaid
Fig. 17. Subject u013, 5-minute segment. This recording contains a LOCOMOTION-dominant episode with brief interspersed MISC and STATIC transitions. The fine-label classifier correctly identifies the dynamic changes in the signal envelope, including the transition from low-amplitude miscMovement to higher-amplitude locomotion around t = 150 s.
Subject 2511531: 5-minute segment with coarse+fine activity predictions overlaid
Fig. 18. Subject 2511531, 5-minute segment. A longer STATIC period (grey background, lying or sitting) is followed by LOCOMOTION activity visible as a dense oscillatory burst. The shift from near-zero dynamic acceleration to a 1–2 g amplitude oscillation is unambiguously classified, validating the pipeline on a third independent subject.
Clinical relevance: The Respeck sensor is already deployed in post-operative and COPD patient monitoring for continuous respiratory rate tracking. Extending it to activity classification — particularly the ability to distinguish lying postures, walking, and stair-climbing — enables automated bed-rest vs. mobilisation monitoring and adds context to respiratory rate measurements (a patient running vs. lying down has very different normal respiratory rates). The 12 Hz / discrete-component constraint makes this pipeline deployable on low-power edge devices without GPU acceleration.